|
CoMD
A Mini-app for Co-Design of Classical Molecular Dynamics.
|


|
|
CoMD
A Mini-app for Co-Design of Classical Molecular Dynamics.
|
|
Performance timer functions. More...
#include "performanceTimers.h"#include <stdio.h>#include <sys/time.h>#include <string.h>#include <stdint.h>#include <inttypes.h>#include <math.h>#include "mytype.h"#include "parallel.h"#include "yamlOutput.h"
Go to the source code of this file.
Data Structures | |
| struct | TimersSt |
| Timer data collected. More... | |
Typedefs | |
| typedef struct TimersSt | Timers |
| Timer data collected. More... | |
Functions | |
| static uint64_t | getTime (void) |
| Returns current time as a 64-bit integer. More... | |
| static double | getTick (void) |
| Returns the factor for converting the integer time reported by getTime into seconds. More... | |
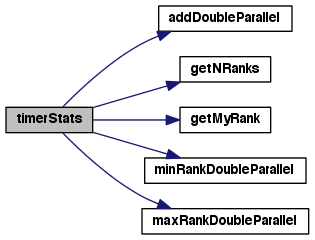
| static void | timerStats (void) |
| Collect timer statistics across ranks. More... | |
| void | profileStart (const enum TimerHandle handle) |
| Use profileStart and profileStop only for timers that should never be turned off. More... | |
| void | profileStop (const enum TimerHandle handle) |
| double | getElapsedTime (const enum TimerHandle handle) |
| Use to get elapsed time (lap timer). More... | |
| void | printPerformanceResults (int nGlobalAtoms) |
| Print timing results. More... | |
| void | printPerformanceResultsYaml (FILE *file) |
| Print timing results to Yaml file. More... | |
Variables | |
| char * | timerName [numberOfTimers] |
| You must add timer name in same order as enum in .h file. More... | |
| static Timers | perfTimer [numberOfTimers] |
Performance timer functions.
Use the timer functionality to collect timing and number of calls information for chosen computations (such as force calls) and communication (such as sends, receives, reductions). Timing results are reported at the end of the run showing overall timings and statistics of timings across ranks.
A new timer can be added as follows:
Note that the order of the handles and names must be the same. This order also determines the order in which the timers are printed. Names can contain leading spaces to show a hierarchical ordering. Timers with zero calls are omitted from the report.
Raw timer data is obtained from the getTime() and getTick() functions. The supplied portable versions of these functions can be replaced with platform specific versions for improved accuracy or lower latency.
Definition in file performanceTimers.c.
Timer data collected.
Also facilitates computing averages and statistics.
| double getElapsedTime | ( | const enum TimerHandle | handle | ) |
Use to get elapsed time (lap timer).
Return elapsed time (in seconds) since last call with this handle and clear for next lap.
Definition at line 99 of file performanceTimers.c.

|
static |
Returns the factor for converting the integer time reported by getTime into seconds.
The portable getTime returns values in units of microseconds so the conversion is simply 1e-6.
Definition at line 225 of file performanceTimers.c.
|
static |
Returns current time as a 64-bit integer.
This portable version returns the number of microseconds since mindight, Jamuary 1, 1970. Hence, timing data will have a resolution of 1 microsecond. Platforms with access to calls with lower latency or higher resolution (such as a cycle counter) may wish to replace this implementation and change the conversion factor in getTick as appropriate.
Definition at line 211 of file performanceTimers.c.
| void printPerformanceResults | ( | int | nGlobalAtoms | ) |
Print timing results.
The report contains two blocks. The upper block is performance information for the printRank. The lower block is statistical information over all ranks.
Definition at line 111 of file performanceTimers.c.
| void printPerformanceResultsYaml | ( | FILE * | file | ) |
Print timing results to Yaml file.
Definition at line 159 of file performanceTimers.c.

| void profileStart | ( | const enum TimerHandle | handle | ) |
Use profileStart and profileStop only for timers that should never be turned off.
Typically this means they are outside the main simulation loop. If the timer is inside the main loop use startTimer and stopTimer instead.
Definition at line 83 of file performanceTimers.c.
| void profileStop | ( | const enum TimerHandle | handle | ) |
Definition at line 88 of file performanceTimers.c.

|
static |
Collect timer statistics across ranks.
Definition at line 232 of file performanceTimers.c.

|
static |
Definition at line 81 of file performanceTimers.c.
| char* timerName[numberOfTimers] |
You must add timer name in same order as enum in .h file.
Leading spaces can be specified to show a hierarchy of timers.
Definition at line 49 of file performanceTimers.c.
 1.8.3.1